Since BNG became mandatory for major developments in February 2024 — and for small sites in April 2024 — ecology consultancies across England have faced an uncomfortable truth: the tools and workflows that served them for Phase 1 habitat surveys were not built for the precision, collaboration, and reporting demands of Biodiversity Net Gain and EIA.
We've spent the past 2 years working alongside ecology teams delivering BNG assessments day in, day out. The same seven problems come up in nearly every conversation. They aren't theoretical. They are costing real consultancies real time, and they're causing friction with planners, developers, and each other.
Here's what we've seen — and what the teams who've solved these problems did differently.
7 BNG problems and solutions we will cover In this article:
- The Map That Didn't Line Up — Coordinate Reference System Conflicts
- The Habitat Areas That Were Counted Twice — Overlapping Polygons
- The Drone Images That Never Made It Onto the Map — UAV Integration Friction
- The Boundary That Was 12 Metres Off — GPS Drift in the Field
- The Survey Notes Nobody Could Read — Field Data Recording Under Pressure
- The Metric Submission That Got Bounced — Reporting Format Errors
- The Map Nobody Else Could Open — Siloed GIS Projects Across the Team
The Map That Didn't Line Up — Coordinate Reference System Conflicts
"We overlaid the landscape architect's CAD plan onto our habitat map and nothing sat where it should."
WHAT HAPPENED
An ecology consultancy was delivering a BNG assessment for a mixed-use development in the Midlands. The landscape architect had provided the proposed site design as a DWG file created in AutoCAD. The ecology team had completed their UKHab baseline survey using QGIS with Ordnance Survey base mapping — referenced to the OS British National Grid (EPSG:27700).
When they imported the CAD file, every feature was displaced by several metres. The landscape plan had been drawn using a "local grid" — an arbitrary coordinate origin set at the corner of the site, common in architectural practice but completely incompatible with geographic coordinate systems. Without ground control points to geo-reference the data, the two layers simply could not be compared.
It took three days of back-and-forth with the landscape architect, manually identifying fence corners and building edges as control points, before they could align the datasets well enough to run an intersect analysis to calculate retained versus lost habitats.
The real cost: Three days of senior ecologist time, plus the risk of positional errors cascading into incorrect area calculations in the Statutory Biodiversity Metric — errors that can lead to a planner rejecting the entire submission.
HOW THIS GETS SOLVED
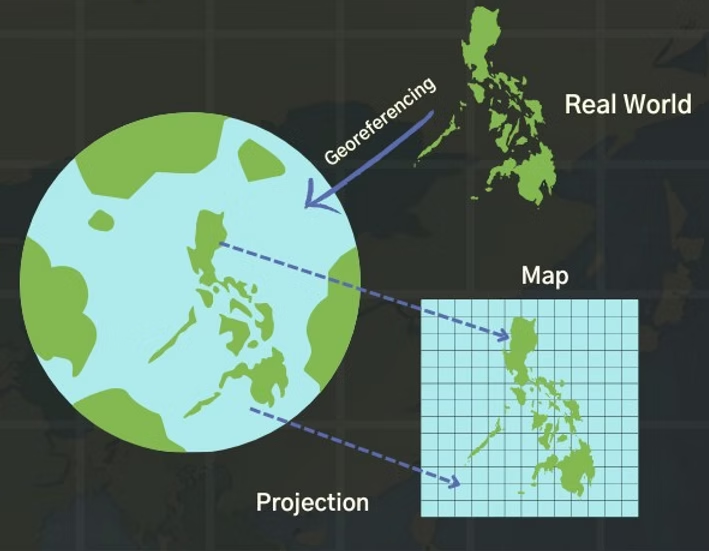
The issue is fundamentally about bringing data from different coordinate reference systems into a single, accurate view. Nika's mapping platform handles CRS transformation automatically. When data arrives in WGS 84, British National Grid, a local CAD grid, or any other projection, Nika places each layer with the correct correction onto a unified Mercator map. There's no manual georeferencing, no hunting for control points, and no risk of a silent misalignment throwing off your area calculations.
The team now imports CAD plans alongside OS base mapping and satellite imagery in the same session. What used to take three days of alignment work happens on import.
The Habitat Areas That Were Counted Twice — Overlapping Polygons
"Our BNG metric showed 14% net gain, but when the planner checked our GIS files, some areas were double-counted."
WHAT HAPPENED
A firm working on a residential development in the South East received the proposed landscape plan as a CAD file. The landscape architect had drawn the design the way it visually made sense: a lake feature placed "on top of" an aquatic marginal vegetation polygon, which itself sat over a neutral grassland area. On screen, it looked correct — you could see the lake, the marginal planting, and the surrounding grassland.
But in GIS terms, these were overlapping polygons, not mutually exclusive habitat parcels. When area calculations were run for the BNG metric, the same physical land was being counted in multiple habitat categories. The result was a biodiversity unit total that overstated the baseline — and the proposed net gain figure was inflated as a consequence.
The planning authority's ecologist spotted the issue during review. The submission was sent back. The consultancy had to manually "clip" every overlapping polygon into a nested set of doughnut polygons — lake cut out of marginal vegetation, marginal vegetation cut out of grassland — before recalculating. This is exactly the process described in Natural England's own GIS guidance, but it's tedious, error-prone, and entirely manual in traditional GIS software.
The real cost: A rejected planning submission, two weeks of rework on GIS data, and a strained client relationship. All because the map "looked right" but wasn't structured correctly for area-based calculations.
HOW THIS GETS SOLVED
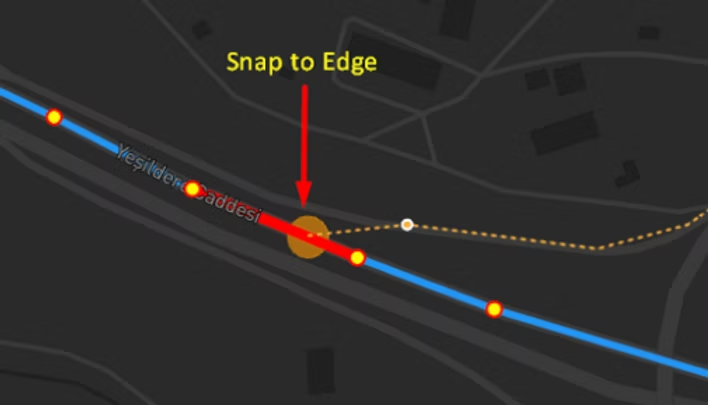
Nika's mapping tools include polygon snapping and edge-alignment capabilities designed specifically for this kind of work. When you draw or edit a habitat polygon, Nika lets you snap its edges precisely to adjacent polygon boundaries or polyline features — like hedgerow centre lines. This means habitat parcels are drawn as genuinely adjacent and mutually exclusive from the start, rather than being layered on top of each other.
Instead of spending hours clipping and splitting overlapping features after the fact, the map is structured correctly as you build it. Every polygon edge aligns cleanly with its neighbour. No gaps, no overlaps, no double-counting.
The firm now delivers their UKHab mapping with clean, non-overlapping geometry that passes planner review first time. The polygon snapping alone saves roughly a day per site on data cleaning.
The Drone Images That Never Made It Onto the Map — UAV Integration Friction
"We had beautiful drone footage of the inaccessible scrub. Getting it into our GIS project was another story entirely."
WHAT HAPPENED
A consultancy was surveying a large greenfield site in the North West where several areas were inaccessible due to dense scrub and waterlogged ground. They deployed a UAV to capture high-resolution top-down imagery of the areas they couldn't walk — a common and sensible approach for BNG habitat identification, particularly for ground-truthing large areas of homogenous habitat types.
The drone flight itself was efficient: two hours of flying, several hundred images captured at 2cm resolution. Cloud-based photogrammetry tools have made the stitching and orthorectification faster than it used to be — that part of the pipeline has genuinely improved. But the friction wasn't in the processing. It was in everything around it.
The images had to be uploaded to one platform for processing, exported as a GeoTIFF, then imported into QGIS, checked for positional accuracy against OS base mapping, and adjusted where the alignment wasn't quite right. The team was managing three separate pieces of software — the drone controller app, the photogrammetry platform, and their desktop GIS — each with its own file formats, coordinate handling, and export quirks. When a second ecologist needed to see the imagery on their machine, the 4GB orthomosaic had to be copied across the network. When the client asked to see the drone view overlaid on the habitat map, another export-import cycle began.
The processing might take hours rather than weeks these days, but the total time from flight to "imagery usable by the whole team inside the actual BNG project" was still several days of fiddling across disconnected tools.
The real cost: Not one big delay, but a steady tax on every drone survey — the cost of maintaining multiple software subscriptions, the time lost to format conversions and file transfers, and the reality that most of the team couldn't access the imagery until someone completed the full export pipeline. For a consultancy running drone flights on dozens of BNG sites per year, this adds up quickly.
HOW THIS GETS SOLVED
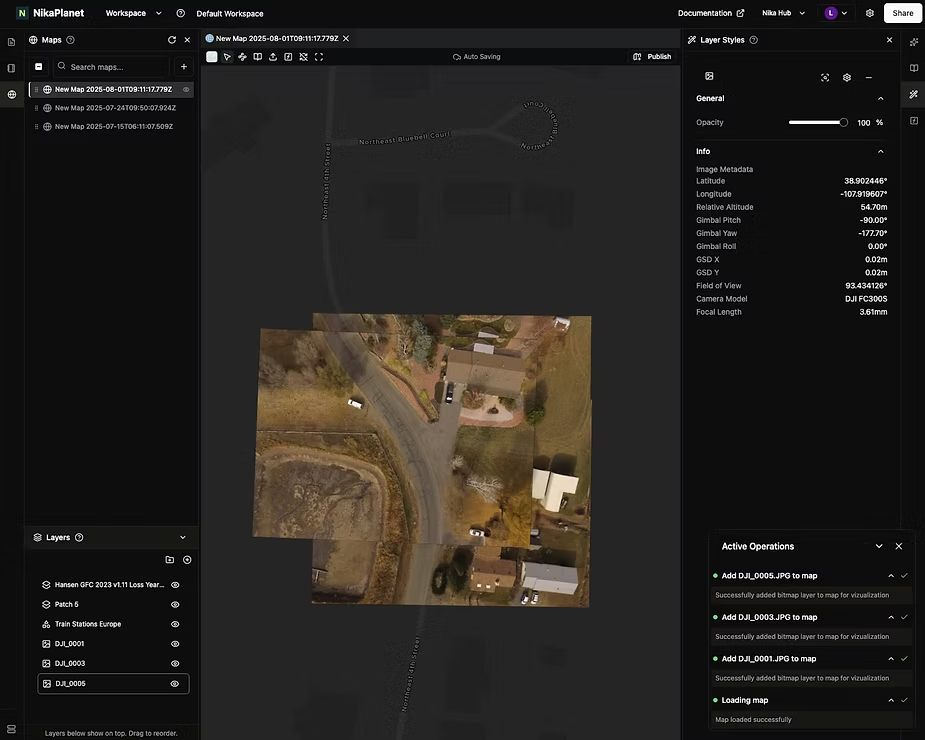
Nika eliminates the multi-tool pipeline entirely. Drone images taken from a top-down perspective can be dragged and dropped directly into the Nika map — the same map where the team is already doing their UKHab classification and habitat boundary work. The platform runs orthorectification server-side, automatically placing each image in its correct geographic position based on the embedded GPS metadata and terrain correction algorithms.
There's no separate photogrammetry subscription, no GeoTIFF export-import cycle, no 4GB file to copy across the network. The images land directly in the project where they're needed, visible to the whole team immediately. It's one drag-and-drop step instead of a three-software pipeline.
The team now gets drone imagery into their BNG project on the same day as the flight, without leaving the platform they're already working in. The simplicity of a single drag-and-drop means even junior ecologists can process UAV data without needing to learn photogrammetry software.
The Boundary That Was 12 Metres Off — GPS Drift in the Field
"We mapped the hedgerow boundary on-site, but back in the office it was sitting in the middle of the adjacent field."
WHAT HAPPENED
A surveyor was recording habitat boundaries on a development site in rural Yorkshire using their phone's built-in GPS. The location accuracy was decent, as dual-frequency GNSS chipsets in recent iPhones and Android flagships can achieve 1 to 2 metre accuracy in open sky conditions.
But BNG sites also consist of under canopy scenarios. When the surveyor moved to the northern section of the site, bordered by mature woodland, the phone's GPS accuracy collapsed. Under tree canopy, even dual-frequency smartphone GNSS degrades dramatically — published research confirms that smartphone pseudorange measurements remain "noisier by about one order of magnitude" compared to dedicated receivers, and canopy, buildings, and terrain multiply that noise. The phone was drifting by 8 to 12 metres, silently. The surveyor didn't notice in the field — the location marker still appeared roughly correct on the small screen.
It was only when the data was downloaded in the office and overlaid on OS Mastermap that the problem became obvious. The recorded hedgerow boundary was displaced by 12 metres, placing it well inside the adjacent farmer's field rather than along the site boundary. Because the hedgerow was a linear feature central to the BNG metric calculation — both for hedgerow units and for the condition assessment of adjacent habitats — the error wasn't something that could be fudged. The surveyor had to return to site to re-survey the boundary.
The real cost: A full return visit to site, a day of lost productivity, travel expenses, and a project delay. Phone GPS has improved in the open, but BNG habitat surveys routinely involve woodland edges, hedgerow corridors, scrub, and riparian zones — exactly the conditions where phone GNSS still falls apart. And crucially, phone GPS gives no warning when accuracy drops. The surveyor simply doesn't know their data is drifting until it's too late.
HOW THIS GETS SOLVED
Nika's field app connects directly with survey-grade GNSS receivers such as the Emlid Reach series via Bluetooth Low Energy. This provides real-time positional accuracy of +/- 2 centimetres — consistent accuracy that holds up under canopy, near buildings, and in the challenging terrain conditions that are typical of BNG development sites. The difference isn't incremental: it's the gap between "close enough in open sky but unreliable where it matters" and "centimetre-level accuracy everywhere on the site."
Critically, Nika also includes a live deviation alert — the feature that addresses the silent failure problem. If the GNSS signal quality drops below your set accuracy threshold, the app warns the surveyor immediately, in the field, before they record inaccurate data. A phone GPS gives no such warning; it just quietly drifts. With Nika, the surveyor knows in real time whether their position fix is good enough for BNG-grade boundary mapping.
The consultancy hasn't had a single return-to-site visit for GPS accuracy issues since switching to GNSS-connected field surveys. Their data passes planner review on geometric accuracy every time.
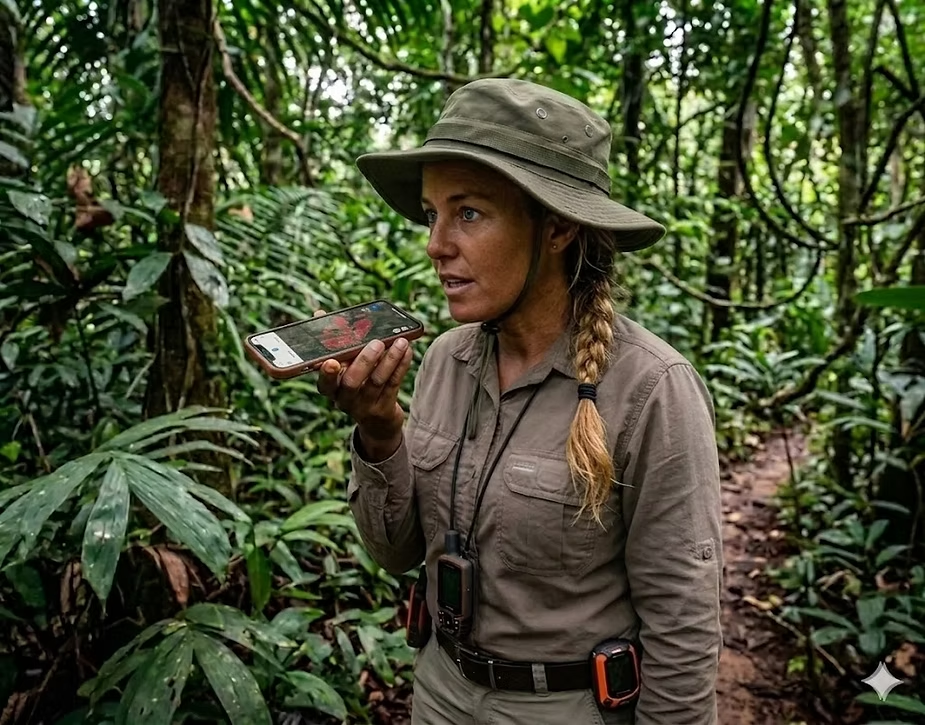
The Survey Notes Nobody Could Read — Field Data Recording Under Pressure
"By the time I got back to the office, I couldn't tell if I'd written 'moderate' or 'modified' for the grassland condition."
WHAT HAPPENED
A senior ecologist was conducting a UKHab condition assessment on a large development site in the East of England. The survey involved walking over 30 distinct habitat parcels in a single day, recording the UKHab code, condition assessment criteria, species observations, photographs, and any notes on management evidence — for each parcel.
To be fair, digital field apps have improved things. Several platforms now offer structured UKHab data collection forms on a tablet, with dropdown menus for habitat codes and condition criteria. The days of pure paper-and-clipboard surveys are fading. But the core ergonomic problem hasn't gone away: the ecologist is still physically juggling a tablet, a dedicated GPS receiver on a pole, a camera, and occasionally a hand lens and quadrat frame. When it started raining mid-morning, the touchscreen became difficult to use. With muddy gloves, tapping small dropdown menus and typing notes was slow, frustrating, and error-prone. Several condition assessment fields were left blank — not because the app didn't offer the right options, but because stopping to carefully tap through a form while holding a GPS pole in the other hand wasn't practical in the moment.
Back in the office, the data that had been entered digitally was cleaner than paper notes would have been — but the gaps were still there. Two condition assessments had incomplete observations. Three photographs were mismatched to the wrong habitat parcels because the file naming convention broke down mid-survey. The structured form captured what was entered, but it couldn't capture what was skipped.
The real cost: Digital forms have reduced transcription errors, but they haven't solved the fundamental problem: a surveyor in the field has too many things in their hands and not enough time to stop and carefully type at every habitat parcel. The result is still blank fields, skipped observations, and return visits — just fewer of them than the paper era. At a time when 41% of local authorities are concerned about ecological expertise capacity, every unnecessary return visit is capacity the industry can't afford to waste.
HOW THIS GETS SOLVED
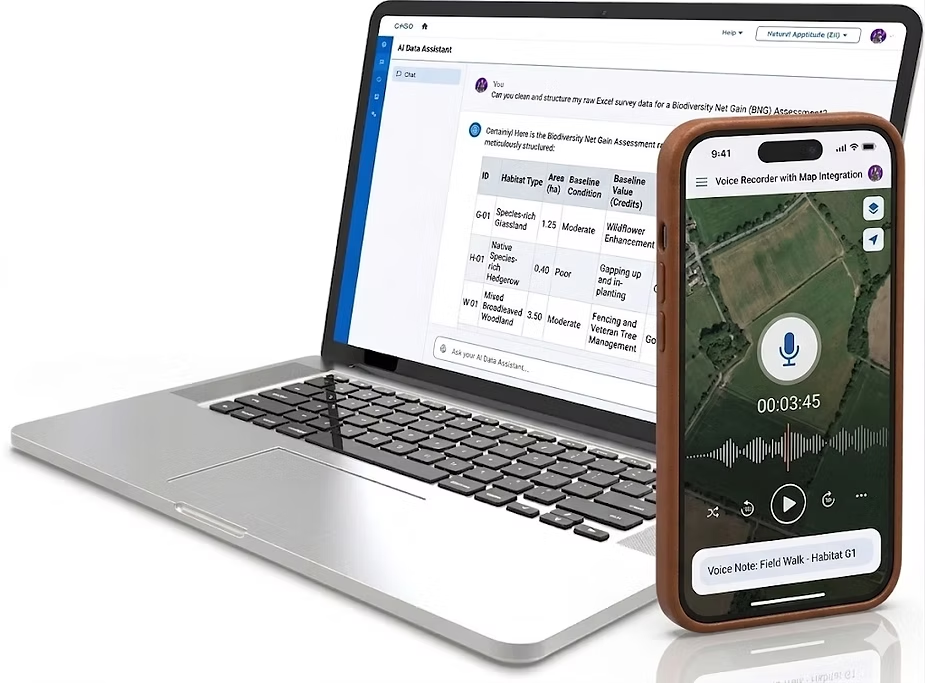
Nika's field app includes an active voice recording assist mode — and this is the step beyond what current digital field apps offer. Instead of stopping to tap through form fields on a touchscreen, surveyors simply talk. Describe the habitat, note the condition indicators, flag anything unusual — all captured as a structured voice recording tagged to the exact map location and habitat parcel.
The voice assist model is designed for field conditions: it handles wind noise, rain, technical ecological terminology like UKHab codes and condition criteria, and the natural conversational way surveyors actually describe what they're seeing. The difference from a digital form is that nothing gets skipped because the surveyor's hands were full. Observations that would have been left as "I'll fill that in later" are spoken and captured in the moment, while the surveyor's hands are free for the GPS pole, the camera, or the hand lens.
The ecologist still uses structured digital forms for the core data entry — but supplements them with voice notes for the detailed observations, context, and nuance that get lost when you're tapping a touchscreen in the rain. The combination of form plus voice has virtually eliminated the "blank fields" problem, and the team reports far fewer return visits for missing condition data.
The Metric Submission That Got Bounced — Reporting Format Errors
"We spent two weeks on the assessment. The planner rejected it in twenty minutes because the metric workbook had errors."
WHAT HAPPENED
A mid-sized ecology consultancy was submitting a BNG assessment for a significant residential development. The ecologist had completed the field survey, produced the UKHab mapping, run the intersect analysis for baseline versus proposed habitats, and then spent the best part of two weeks manually populating the Statutory Biodiversity Metric Excel workbook.
The SBM workbook is a substantial spreadsheet — multiple tabs covering site-level information, baseline habitats (area, linear, and watercourse), proposed habitats, off-site provisions, and summary calculations. Each tab has specific data validation rules, dropdown menus, and conditional formatting. Getting data from the GIS output into the correct cells, in the correct format, with the correct UKHab codes, habitat condition categories, and strategic significance classifications — all while ensuring the internal logic of the spreadsheet remains intact — is a painstaking process.
In this case, two errors slipped through. A habitat condition was entered as free text rather than selected from the dropdown, which broke a downstream formula. And one habitat parcel's area in the metric didn't match the area shown on the submitted GIS map — because the ecologist had updated the map boundary after populating the spreadsheet and forgot to update the corresponding cell. The planning authority's ecologist flagged both issues and returned the submission for correction.
The real cost: 2 weeks of manual data entry followed by a rejected submission, a further round of corrections, and a delay to the planning determination. The consultancy estimated they spend an average of 8 to 12 working days per site on metric population and reporting — time that doesn't generate new revenue and is entirely dependent on one or two people who understand the workbook's internal logic.
HOW THIS GETS SOLVED
Nika's AI reporting engine uses a language model trained on the specific requirements of the Statutory Biodiversity Metric framework. Rather than manually transferring data from GIS to spreadsheet cell by cell, the system takes the habitat data collected through Nika — the UKHab classifications, condition assessments, area calculations, and strategic significance ratings — and produces a properly formatted metric output.
The AI checks for internal consistency: do the areas in the metric match the GIS? Are all condition fields populated from valid options? Do the habitat codes match the UKHab classification hierarchy? Are the trading rules satisfied? Issues that a human might miss after hours of manual entry are flagged automatically, before submission.
What used to take 8 to 12 working days now takes a single day. The consultancy has not had a metric submission rejected for formatting or data consistency errors since adopting the automated reporting workflow.
The Map Nobody Else Could Open — Siloed GIS Projects Across the Team
"The lead ecologist went on leave. Nobody else could find or open his QGIS project for the client meeting."
WHAT HAPPENED
A growing ecology consultancy with eight ecologists across two offices had a workflow that's common in the industry: each surveyor maintained their own QGIS or ArcGIS projects on their local machine or, at best, on a shared network drive with a folder structure that made sense only to them.
When a developer client called to request an urgent update on their BNG assessment for a planning meeting the following week, the project manager discovered that the lead ecologist was on annual leave. The QGIS project file was on the ecologist's laptop — which was with them. A backup existed on the office server, but it referenced shapefile paths on the C: drive that didn't exist on anyone else's machine. The symbology was broken, the basemap layer had expired credentials, and the proposed habitat layer was an older version that didn't include the latest design revisions.
The team spent a day and a half reconstructing a presentable map from the shapefiles they could find, email attachments with previous versions, and the ecologist's hurried instructions sent via WhatsApp from their holiday.
When the client asked whether they could "just see the map" ahead of their meeting with the planner, the consultancy had to export it as a static PDF — because sharing a live QGIS or ArcGIS project with a non-technical client is effectively impossible without them installing desktop software and understanding how to navigate GIS layers.
The real cost: A day and a half of panicked rework, an interrupted holiday, a client who received a static PDF instead of an interactive map, and a growing sense within the team that their data management wasn't scaling with the volume of BNG work coming in. Research shows that siloed geospatial data is one of the most common blockers to efficient collaboration in environmental consultancies.
HOW THIS GETS SOLVED
Nika provides the same core mapping capabilities as QGIS and ArcGIS — layer management, polygon drawing and editing, attribute tables, spatial analysis — but as a cloud-native, collaborative platform. Every map is persisted online, accessible to any authorised team member from any device, with no local file paths to break and no project files trapped on someone's laptop.
Multiple ecologists can work on the same site map simultaneously. Version history is automatic. And when a client or a planner needs to see the map, the consultancy simply shares a link — no software installation, no desktop GIS expertise required. The recipient opens a browser and sees the live, interactive map with all its layers, exactly as the ecology team sees it.
The consultancy now runs all BNG projects through a single collaborative workspace. Any team member can pick up any project. Clients receive shareable map links instead of static PDFs. And nobody's holiday gets interrupted because a file is trapped on their laptop.
This map is accessible directly at https://planet.nika.eco/en/hub/maps/dd0eead4-4498-445e-ac7c-367820a7a019 but user can choose to share any map with password protection on Nika too.
Bonus: Three More Pain Points We Keep Hearing About
Beyond the seven stories above, three additional challenges come up frequently enough to be worth flagging — especially if you're evaluating your BNG workflow for the year ahead.
Hedgerow mapping complexity: Section 9 of the Biodiversity Metric 4.0 User Guide changed how hedgerows should be recorded — as centre lines with adjacent habitats mapped up to the line, rather than as polygon or linear features interchangeably. When proposed landscape plans arrive from CAD with hedgerows drawn as thin polygons, converting them into compliant centre-line features with correctly split adjacent habitat polygons is a fiddly, time-consuming process. Nika's snapping and splitting tools make this conversion significantly faster.
Google Imagery positional errors: Many ecologists use Google satellite imagery for initial desktop assessments. But Google's mosaicked imagery can be displaced by up to 50 metres from true position, and the "joins" between images can shift features by 5 metres or more. This is fine for getting a general sense of a site, but it's dangerously inaccurate for drawing habitat boundaries that will feed into BNG area calculations. Nika's base mapping uses properly referenced imagery sources that avoid these silent accuracy traps.
Minimum Mapping Unit decisions: UKHab guidelines recommend a Minimum Mapping Unit of 25m² for large-scale surveys and 400m² for broader-scale work, but there's no hard minimum for BNG. Choosing the wrong MMU for the site scale leads to either excessive detail (wasting time) or insufficient detail (missing small but ecologically significant habitat parcels). Nika's mapping tools let teams set and enforce MMU thresholds at the project level, ensuring consistency across surveyors and sites.
Stay tuned for more industrial geoinsights ~