A senior bat ecologist at a mid-sized UK firm recently told me something that stuck: "I've spent 22 years building a mental map of every roost, every flight line, every seasonal shift across the sites I've surveyed. When I retire next year, none of that leaves the building with me — it's all in my head."
If you've worked in any specialist industry — law, engineering, architecture, medicine — this will sound familiar. The most valuable knowledge in a team often lives in the heads of the most experienced people. It's the pattern recognition that takes a decade to develop and can't easily be written into a handover document. Ecology surveying has its own version of this challenge, and it comes with a twist that makes it harder than most.
Why this hits ecology surveying harder than most
The UK's Biodiversity Net Gain mandate, which became compulsory for major developments in February 2024, created a sharp increase in demand for ecological surveyors. CIEEM has highlighted a growing skills and capacity challenge in the sector. Only around a third of Local Planning Authorities have access to an in-house ecologist, according to an ALGE-ADEPT survey — the rest rely on external consultants or shared arrangements. The firms that do have experienced staff are stretched thin, and many of their most knowledgeable people are approaching retirement.
Here's what that means in practice.
A senior ecologist surveys a 30-hectare development site in Hampshire. She knows, from 15 years of working in that catchment, that the drainage ditch along the eastern boundary supports water voles — not because she saw them on this visit, but because she surveyed the same ditch in 2014, 2017, and 2021. She knows that barbastelle bat roosts have been recorded across several locations in the adjacent woodland complex since at least 2016 — some confirmed, some suspected, the pattern building over years of repeat surveys. She knows that the condition of the lowland meadow has deteriorated since the tenant farmer changed grazing regime in 2019.
None of this is in the project file. It's in her experience.
When she writes the Biodiversity Gain Plan, all of that accumulated context shapes the quality of the assessment — the habitat condition scores, the strategic significance judgments, the recommendations for post-development monitoring. A junior ecologist, working from the same field data but without that 15-year mental map, would produce a technically compliant but fundamentally thinner piece of work.
The Statutory Biodiversity Metric 4.0 spreadsheet doesn't have a column for "institutional memory." But institutional memory is what separates a good ecological assessment from a defensible one.
What we learned building knowledge systems for ecology teams
At Nika, we've started a programme to help 5 ecology surveying enterprises convert their accumulated knowledge — from text reports, shapefiles, spreadsheets, and various file formats — into a continuously improving knowledge base.
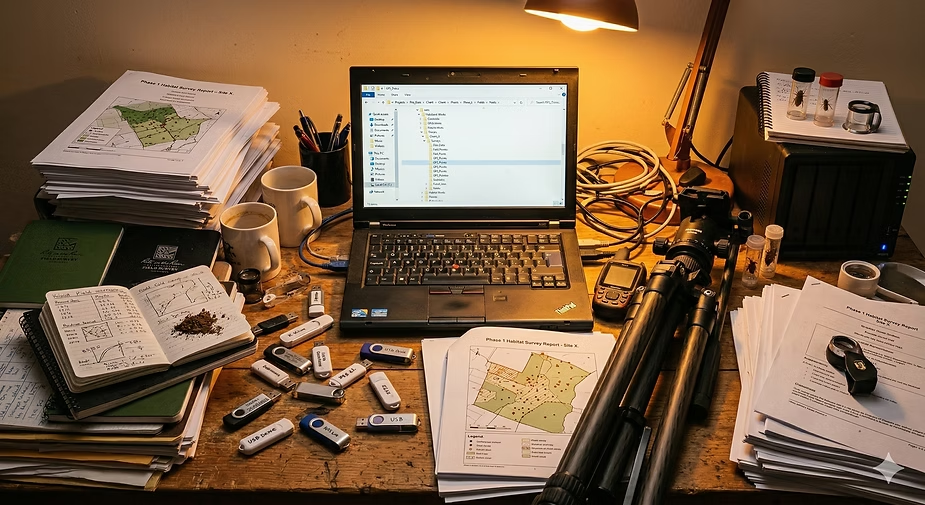
Over the past year, working closely with these teams across the UK, we kept hearing the same frustration: gigabytes of survey data sitting in folders, shapefiles on USB drives, species records in personal spreadsheets, condition assessment notes in Word documents nobody can find. Valuable data, collected at significant cost, effectively inaccessible after the project closes.
So we started experimenting with building knowledge bases — not generic document search, but structured, spatially-aware systems that understand ecological data in context.
The approach we landed on is quite different from typical enterprise search or chatbot-over-documents solutions. Two things make ecological knowledge fundamentally different from, say, legal or financial knowledge:
It's spatial — and usually multi-location. A bat roost record isn't just a line of text — it's a set of locations recorded across multiple surveys, sometimes over multiple years. And each location's meaning changes depending on what else is nearby: the flight corridor 200 metres east, the foraging habitat on the adjacent farm, the river crossing 500 metres north. Strip the geography and you strip the insight.
It's temporal. A habitat condition assessment from 2019 means something different if you also have the 2016 and 2022 assessments for the same site. Trends matter as much as snapshots.
Most AI knowledge tools treat documents as flat text. They chunk paragraphs, embed them as vectors, and retrieve the closest match to your question. That works reasonably well for contracts or policy documents. It works poorly for ecology, where the answer to "what should I look for on this site?" depends on what was found on nearby sites over the previous decade.
A different architecture: connecting knowledge with location
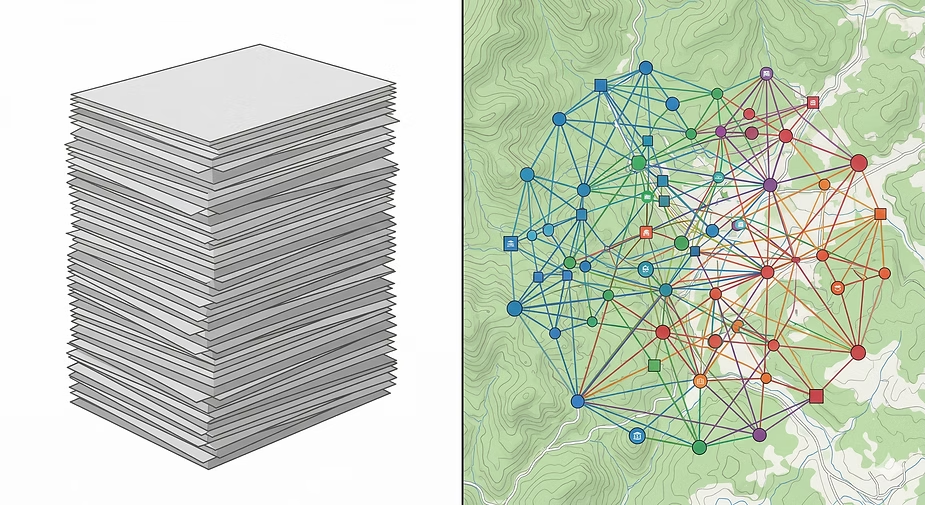
Instead of treating survey reports as bags of words, we structure them as interconnected knowledge — species records linked to the multiple locations where they've been observed, habitats linked to the sites they fall within, sites linked to the broader geographic area, all connected through time.
Think of it as a wiki that writes itself from your firm's accumulated data. Each survey report, each species record, each condition assessment becomes an entry in a connected knowledge base. The links between them capture the relationships: this bat species was recorded at these six roost locations across three years of surveys, which connect to this flight corridor, which crosses this development site, where this habitat condition was assessed in three separate years.
The location layer is critical. We index everything with geographic context — each record is tagged with the areas it relates to, at different scales. A single bat species record might have 12 observation locations spread across a woodland complex; all of those locations are preserved and queryable. A regional query ("what bat species have been recorded in the Test Valley area?") searches broadly. A site-level query ("what's been found within 500 metres of this proposed development?") searches locally.
This means a junior ecologist preparing for a site visit can ask a question like:
"What species records exist within 1km of grid reference SU 3456 7890, and how has the habitat condition changed over the last 5 years?"
And get back not a list of document snippets, but a structured answer with spatial context — a map of nearby records, a timeline of condition changes, and the specific survey reports that support each data point.
Before and after: a UK example
To make this concrete, here's a composite example based on patterns we've seen across several UK ecology surveying firms working on BNG assessments.
The firm: A 12-person ecology surveying firm based in southern England, working primarily on residential and commercial development BNG assessments. They've been operating for 18 years. Two senior ecologists hold most of the institutional knowledge. Three junior ecologists joined in the past two years to handle the BNG workload surge.
Before: the current workflow
A junior ecologist is assigned a preliminary ecological appraisal for a 10-hectare greenfield site near Winchester.
She starts by checking the Multi-Agency Geographic Information for the Countryside (MAGIC) map for designated sites. She requests a data search from the local records centre — typically a 10 working day turnaround, sometimes longer. She checks for European Protected Species licence returns on the Natural England database.
What she can't easily access: her own firm's data. The senior ecologist surveyed a site 800 metres away in 2019 and recorded great crested newt eDNA positive results across a pond complex — three ponds tested, two positive, one negative. Another colleague did bat activity surveys across multiple sites in the area over 2020 and 2021, building up a picture of soprano pipistrelle maternity roost locations along the tree line corridor to the north — not a single point, but a pattern of activity recorded across several survey nights and locations. A third colleague noted that the hedgerow connecting the two sites was in "good" condition under UKHab assessment — a detail that affects distinctiveness scoring in the BNG metric.
This information exists in the firm's files. It's in PDF reports saved in project folders on the server. The GIS data is in shapefiles — some in a shared drive, some on someone's laptop. The bat survey data is in a spreadsheet that the senior ecologist uses personally.

The junior ecologist either doesn't know this data exists, or knows it exists but can't find it, or finds the wrong version, or finds the right version but can't connect it to her site because the spatial relationship isn't obvious from the file structure.
She does the site visit without this context. She produces a technically adequate PEA. But she recommends further bat surveys "as a precaution" because she doesn't know about the maternity roost pattern 800 metres away — a recommendation that could cost the developer an additional £1,500-£3,000 for a season of emergence and activity surveys, and delays the planning timeline accordingly.
Or worse: she doesn't recommend the bat survey, because without the pattern of nearby roost records she doesn't have grounds to. The LPA ecologist, who does know about the maternity activity from their own records, rejects the PEA and requests further survey work. The developer loses months.
After: with a spatial knowledge base
Same ecologist, same site.
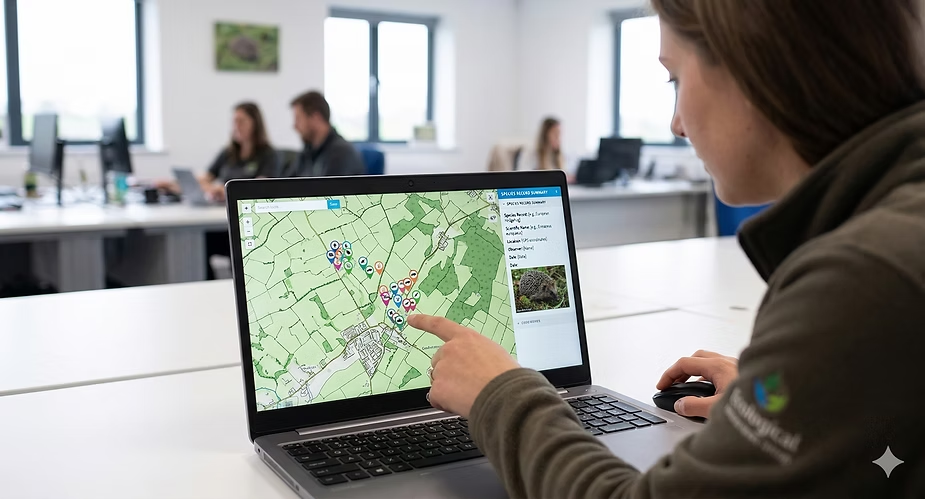
Before leaving the office, she opens Nika on her desktop and queries: "What ecological records exist within 1km of the proposed site boundary?"
The knowledge base returns a structured summary: great crested newt eDNA results across the pond complex 800m southwest — two ponds positive, one negative (2019, surveyed by her colleague). Soprano pipistrelle maternity roost activity recorded at multiple locations along the tree line corridor 800m north (2020-2021, across several survey visits). Hedgerow connecting the two areas assessed as "good" condition under UKHab (2020). Lowland meadow on adjacent land showing a declining condition trend (assessed 2016, 2019, 2022 — shifted from "moderate" to "fairly poor").
Each record is displayed on the map in its geographic context — not as isolated pins, but as patterns across locations. She can see the spatial relationships: the cluster of bat activity points forming a flight corridor, the pond network with eDNA results colour-coded, the hedgerow connectivity linking habitats. She can read the relevant extracts from the original survey reports.
She goes to the field with context. She knows to check the pond complex for newt habitat connectivity. She looks for evidence of bat commuting routes along the hedgerow. She notes the meadow condition with the historical trend in mind.
Her PEA is better. Her BNG metric inputs are more defensible. Her recommendations are proportionate — informed by evidence rather than precaution. The senior ecologist, reviewing the draft, doesn't need to add the context from memory because the junior already had it.
The developer doesn't pay for unnecessary surveys. The LPA ecologist doesn't reject the assessment. The planning timeline doesn't slip.
What this actually changes
The value here isn't efficiency — though that matters. It's the quality of ecological assessment.
This is a familiar challenge in any specialist field. A senior lawyer knows which clauses tend to cause problems in a particular jurisdiction. A senior engineer knows which soil conditions cause foundation issues in a particular region. In ecology surveying, the equivalent is knowing which species have been recorded where, in what patterns, over what timeframe — and what that means for a new site nearby.
BNG is still new. The metric is complex. The case law is still developing. Condition assessments involve professional judgment, and that judgment is only as good as the context behind it. When a senior ecologist scores a hedgerow's condition, they're drawing on decades of comparative observation. A spatial knowledge base doesn't replace that judgment — but it gives junior ecologists access to the accumulated data that informs it.
There's a broader shift happening too. As ecology surveying firms collect more data under BNG's mandatory 30-year monitoring requirements, the volume of longitudinal ecological data is going to grow dramatically. Five years from now, a firm that has structured its monitoring data with location context will be able to answer questions about habitat trajectory that no individual ecologist could hold in their head.
"Is this habitat type trending toward or away from target condition across our portfolio of monitored sites?" That's a question you can only answer with structured, queryable data. Not PDFs in project folders.
The hard part isn't the technology
We've found that the biggest challenge in setting up knowledge bases for ecology teams isn't the software architecture. It's the data archaeology.
Eighteen years of survey reports in varying formats. Shapefiles with inconsistent attribute schemas. Species records in Excel spreadsheets with different column headers depending on who set them up. Habitat classifications that shifted when UKHab replaced Phase 1 mapping. GPS coordinates recorded in different projections — British National Grid, WGS84, local grids from CAD files that landscape architects sent over.
The first step is always the same: help the team consolidate and structure what they already have. That process itself is valuable — firms often discover data they'd forgotten they had, or find that two different projects surveyed overlapping areas in different years, creating an accidental longitudinal dataset.
Once the data is structured with location context, the knowledge base becomes a living system. Every new survey adds to it. Every BNG assessment draws from it. The institutional knowledge compounds rather than degrades.

Where this is heading
We're still early. The teams we work with are still figuring out what questions to ask their own data. But the pattern is clear: the firms that invest in structuring their accumulated knowledge — not just filing it, but making it queryable and location-aware — are going to have a significant advantage as BNG matures and monitoring data accumulates.
The senior ecologist who told me about retiring? She's now spending part of her last year helping her firm structure the knowledge she's accumulated — not as a document handover, but as a living knowledge base her junior colleagues can query from the field.
Her 22 years of mental maps are becoming actual maps. That feels like progress.
Our initial programme with 5 teams has taught us a lot about what works and what doesn't when converting years of ecological survey data into a proprietary knowledge vault. We're now looking to scale this to 30 more teams — across BNG, environmental impact, and ecological monitoring — to stress-test the approach across different specialisms, data volumes, and team sizes. If the results hold up, it could fundamentally change how ecology surveying firms retain and transfer the expertise they've spent decades building.
If your team is sitting on years of survey data and you've been thinking about how to make it more useful — or if you're just curious about what we've learned so far — I'd genuinely like to hear from you. What's worked? What hasn't? Drop me a message.
Lawrence is the founder of Nika, a geospatial company building tools for ecology and environmental surveying teams. He created GeoVault - a Spatial Knowledge Base, Nika's desktop agent, mobile app and cloud GIS platform that are used by firms across the UK, US, Southeast Asia, and Australia for habitat mapping, field survey, and BNG assessment work.