NIKA use case
NIKA for Agriculture
Turn the field data growers already collect into in-season decisions that lift yield and cut input spend.
For agronomists, growers, and ag retailers — scout fields, prescribe inputs, and forecast yield from the cab or the office.
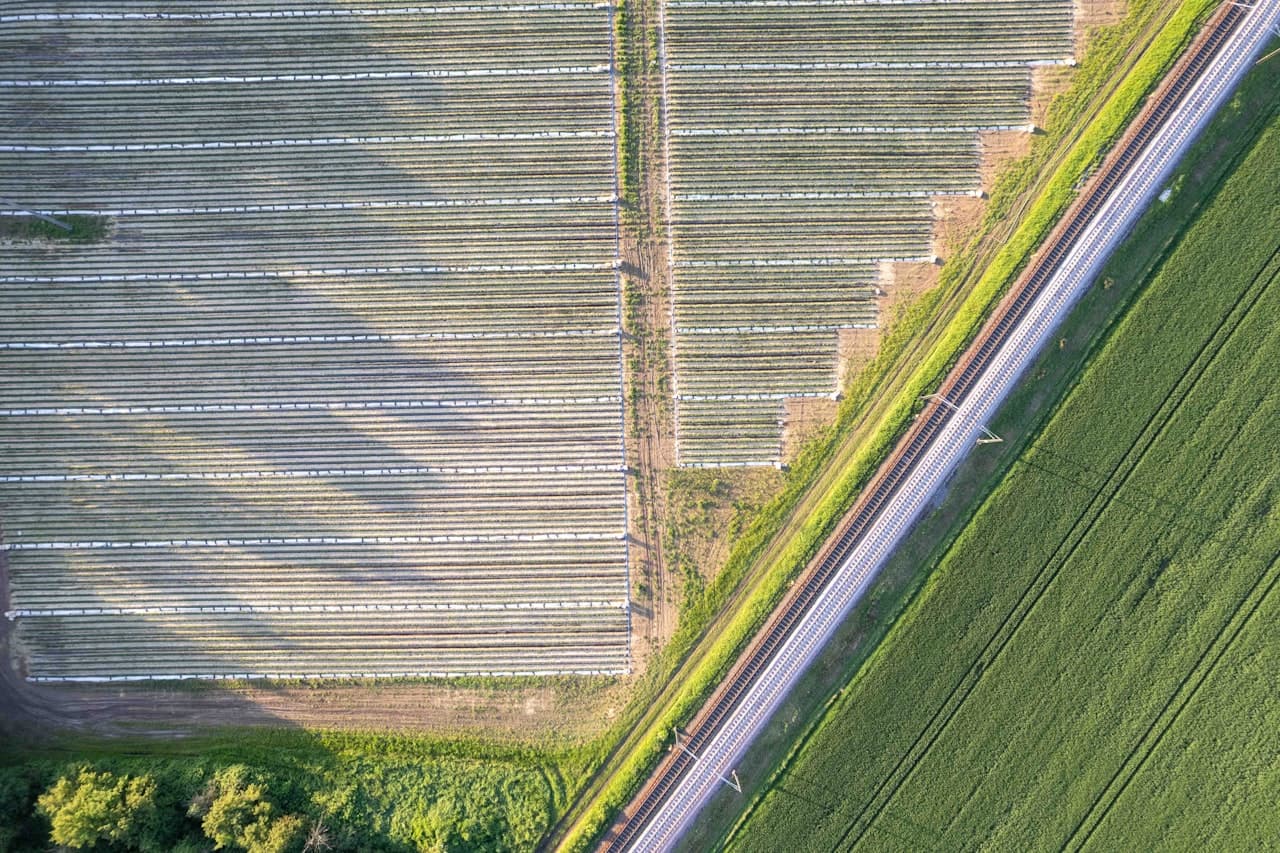 Bernd Dittrich / Unsplash
The challenge
Everything you need exists — just not in one place.
Growers already collect field data from cabs, sensors, and satellites — but it sits in apps that don't talk, so in-season decisions get made on gut.
What NIKA does
How NIKA helps agriculture teams.
Scout every field
Flag low-vigor zones across all fields each week from imagery and machine data.
Prescribe inputs
Build variable-rate nitrogen and seeding maps grounded in soil and yield.
Forecast yield
Project yield per field against the multi-year average.
Products that power this
From the old way to the NIKA workflow.
Growers already collect field data from cabs, sensors, and satellites — but it sits in apps that don't talk, so in-season decisions get made on gut.
- 7 data sources that don’t talk to each other
- Analysts stitch it together by hand — days per question
- Often stale by the time the answer lands
- Scout the fieldNIKA MobileExplore Mobile
Ground-truth low-vigor zones offline and fill scouting forms by voice.
- Decide in-seasonNIKA AnalystExplore Analyst
Turn FieldView and satellite into weekly low-vigor and yield-impact calls.
- Train the modelsNIKA PlanetExplore Planet
Train yield and NDVI models and publish dashboards for the season.
More yield per acre and measurably lower input spend.
How it works
From your data to a decision.
- Step 1
Connect your data
Files, folders, and the platforms your team already pays for.
- Step 2
Ask in plain language
No query language, no technical expertise — just the question.
- Step 3
NIKA reasons across location
It reads, searches, and runs the analysis grounded in real coordinates.
- Step 4
Get the decision
A report, map, or answer you can act on and share.
Data connectors NIKA uses
NIKA plugs into the platforms agriculture teams already pay for, then reasons across them in one place.
- Climate FieldView
- John Deere Ops Center
- EOS Crop Monitoring
- Taranis
- USDA NASS / Cropland Data Layer
- SSURGO soils
- NOAA weather
What you can ask NIKA
- Flag low-vigor zones across all fields this week from FieldView and satellite, and estimate yield impact.
- Build a variable-rate nitrogen prescription for this field.
- Forecast yield versus the 5-year average per field.
More use cases