NIKA use case
NIKA for Utilities & grid
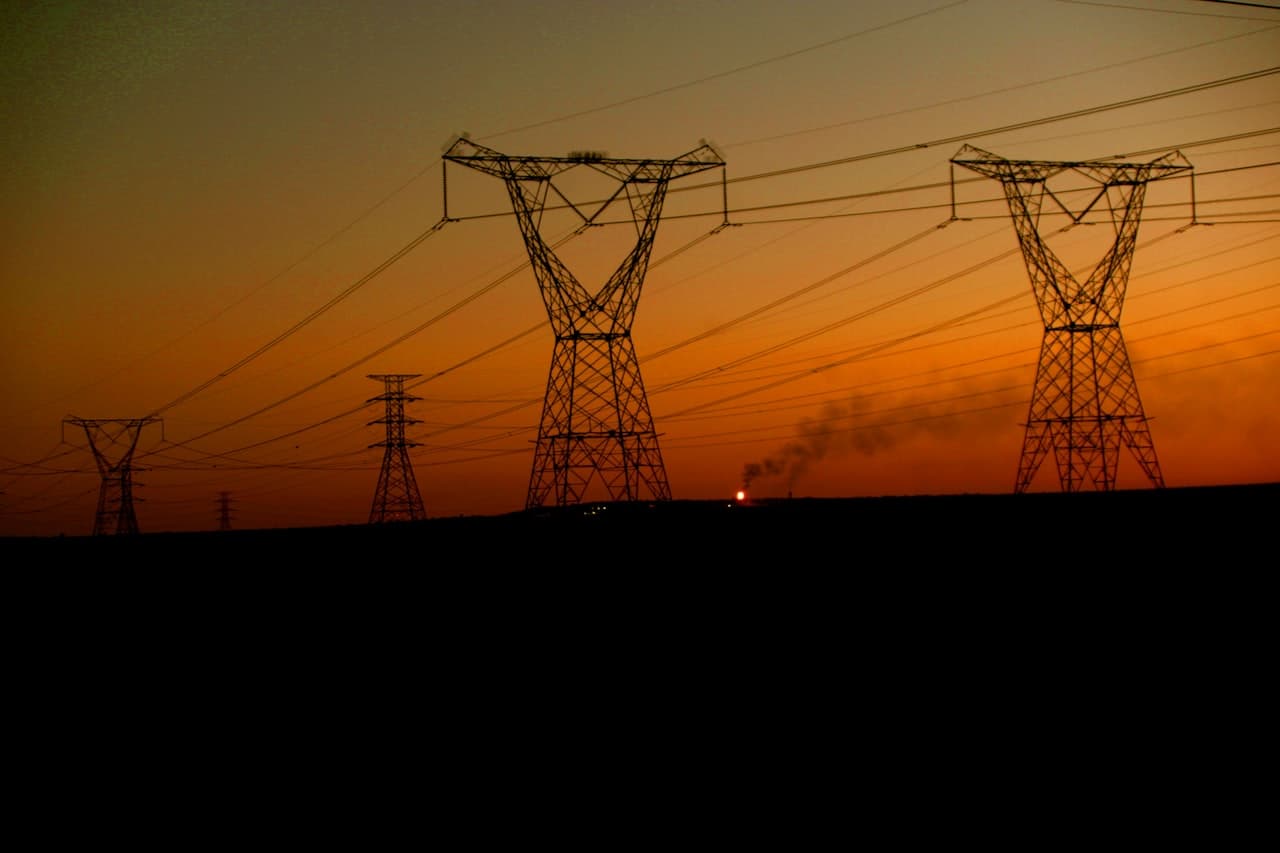
Keep the grid reliable and safe by seeing every asset, every risk, and every outage in one place.
For electric and water utilities — manage grid assets, predict outages, and keep vegetation and wildfire risk off the lines.
 Hush Naidoo Jade / Unsplash
The challenge
Everything you need exists — just not in one place.
Utility assets stretch across thousands of miles, inspected on paper and tracked in silos. Vegetation, weather, and aging equipment cause outages that are hard to predict and costly to chase.
What NIKA does
How NIKA helps utilities & grid teams.
Map every asset
Bring poles, lines, transformers, and substations into one current view.
Predict outages
Combine weather, vegetation, and equipment health to flag where the grid fails next.
Target vegetation & wildfire
Spot encroachment and high-ignition-risk spans from imagery and prioritize crews.
Products that power this
From the old way to the NIKA workflow.
Utility assets stretch across thousands of miles, inspected on paper and tracked in silos. Vegetation, weather, and aging equipment cause outages that are hard to predict and costly to chase.
- 7 data sources that don’t talk to each other
- Analysts stitch it together by hand — days per question
- Often stale by the time the answer lands
- Inspect in the fieldNIKA MobileExplore Mobile
Capture poles, spans, and vegetation offline with survey-grade location.
- Model the riskNIKA GeoEngineExplore GeoEngine
Run vegetation-encroachment and ground-movement models across the network.
- Rank what fails nextNIKA AnalystExplore Analyst
Combine weather, vegetation, and asset age to rank circuits by outage risk.
Fewer outages, safer lines, and maintenance spend aimed where it actually lowers risk.
How it works
From your data to a decision.
- Step 1
Connect your data
Files, folders, and the platforms your team already pays for.
- Step 2
Ask in plain language
No query language, no technical expertise — just the question.
- Step 3
NIKA reasons across location
It reads, searches, and runs the analysis grounded in real coordinates.
- Step 4
Get the decision
A report, map, or answer you can act on and share.
Data connectors NIKA uses
NIKA plugs into the platforms utilities & grid teams already pay for, then reasons across them in one place.
- Esri ArcGIS / GIS of record
- AMI / smart-meter data
- LiDAR & aerial imagery
- Vegetation (NDVI) layers
- NOAA / weather feeds
- Outage management system (OMS)
- Asset & SCADA data
What you can ask NIKA
- Rank circuits by outage risk this storm season from weather, vegetation, and equipment age.
- Find spans where trees are within clearance and route a trimming crew.
- Map every asset due for inspection by district and build the schedule.
More use cases