If you are opening a franchise, your single biggest and least reversible decision is where. The rent is negotiable; the corner is not. And the gap between a good site and a great one is almost always a dataset you did, or did not, look at.
The good news: there has never been more of it. The hard part: it is scattered across a dozen platforms, each strong at one thing and silent on the rest, each priced and scoped for a different kind of buyer — and, as we will see, only some of them can be automated at all. Here is a field guide: what to use, what to watch for, and which tools a machine can actually drive on your behalf.
The four questions every site answers
Strip away the logos and every site-selection tool answers one of four questions: what space is available, who lives nearby, who actually shows up, and what is physically on the ground. Almost no tool answers more than one or two of them well.
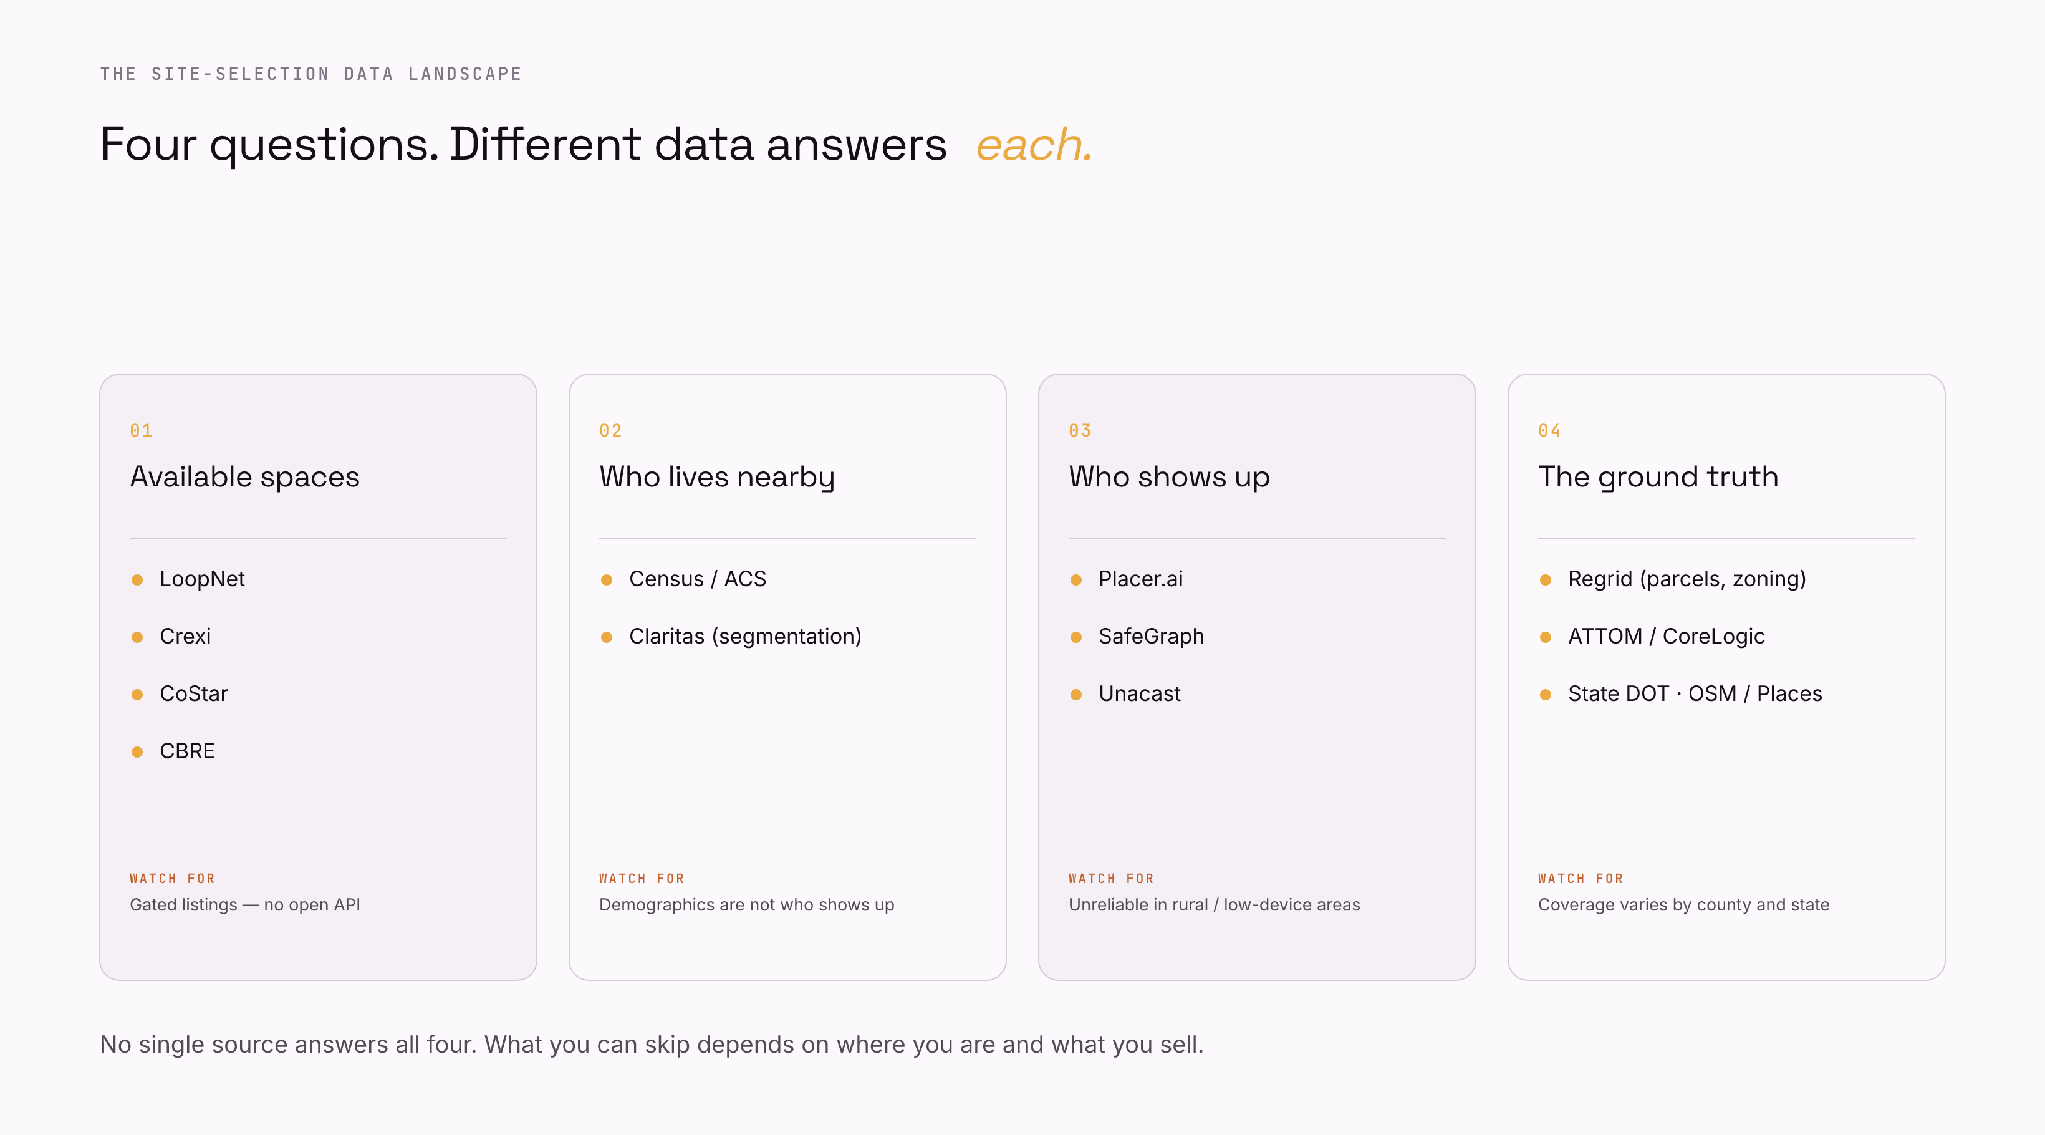
Figure 1 — The site-selection data landscape, grouped by the question each source actually answers.
The sources, head to head
Here is how the major sources stack up. The Gaps & cons column is the one to read first — and treat "cost" as directional, since most of these negotiate.
| Source | Best for | Strengths | Gaps & cons | Rough cost |
|---|---|---|---|---|
| LoopNet (CoStar) | Finding available space, max exposure | Largest CRE marketplace (~13M visits/mo); ~20 yrs of CoStar records | No public API — integration setup needed; stale or aspirational listings; thin analytics for non-paying browsers | Free to browse; paid to advertise |
| Crexi | US listings, auctions, broker workflow | Free browsing; auctions & NDA tools; cheaper PRO; a (paid) data API | API is gated and paid — not open to all; US-only coverage; lighter research than CoStar | Free; PRO ~$300/mo |
| CoStar | Institutional comps & analytics | Gold-standard comps, owners, demographics, a dedicated researcher | API is enterprise-contract only; very expensive; overkill for a single site | From ~$500/mo (often more) |
| CBRE | Full-service siting + advisory | Deep broker knowledge; off-market access; proprietary apps (Dimension, Retail Analytics) | No self-serve, no public API — it is a brokerage; engagement-based, opaque cost; tied to brokered deals, not a neutral feed | Engagement / brokerage fees |
| Census / ACS | Free baseline demographics | Free; income/age/population to block-group; open public API | No foot traffic or behavior; annual lag; needs processing to be useful | Free |
| Placer.ai | Foot traffic, trade areas, benchmarking | Strong visits data & viz; benchmark vs your best stores; has an API | No spend data; unreliable under ~50 devices (rural); API is enterprise-priced | ~$12k–$50k / yr |
| SafeGraph | Raw POI + patterns for custom models | Verified POI; hourly patterns; developer API & flat files | Data, not a platform — needs a GIS/analyst; panel demographic bias | Marketplace pricing |
| Regrid | Parcels, zoning, ownership | Nationwide parcels + zoning + owner; API access | County coverage uneven; subscription required | Subscription / API |
| ATTOM / CoreLogic | Property attributes & comps | Deep property, owner & sales history; API | Enterprise pricing; lighter on CRE listings | Enterprise |
| OSM + Places + DOT | Competitors, co-tenants, traffic counts | Free/low-cost; competitor mapping; open APIs (Overpass, Places); AADT counts | OSM coverage uneven; Places API metered; DOT format varies by state | Free – metered |
Read it this way: LoopNet and Crexi are where you find the storefront; CoStar, CBRE and Placer are where you decide whether it is the right one; and the Census, parcels, OSM and your state DOT are how you do it for free — or fill what the paid tools quietly miss.
The automation tax — who actually has an API
One line in that table matters more than the rest if you ever want software to do the legwork: whether the source has an API built for the computer to programmatically access their data. Look at where the gaps cluster. LoopNet and CoStar gate programmatic access behind enterprise contracts; CBRE is a brokerage, not a feed; even Crexi's API is paid and gated. Meanwhile the free and specialist layers — the Census, OpenStreetMap, Regrid, ATTOM, Placer, SafeGraph — almost all publish one.
The irony writes itself. The data you most want to pull automatically — the live listings — is the hardest to automate, while the context around it is a single request away. For anyone hoping to build a repeatable workflow instead of clicking through tabs, that is the single biggest dividing line on the page.
It depends where you are — and what you sell
There is no universal stack, because the question changes with the concept. A coffee or quick-service brand in a dense downtown lives and dies on foot traffic and daytime population — Placer earns its price there. A car wash or drive-thru in the suburbs cares far more about vehicle counts (your state DOT publishes AADT for free), lot size and zoning (Regrid) than about pedestrians. A gym, daycare or medical concept is a rooftops-and-income game, best answered by the Census and drive-time trade-area analysis.
Geography bends the picture too. In the big coastal metros, every source is rich. In small and rural markets, LoopNet and Crexi thin out, Placer's panel gets unreliable below roughly fifty devices, and you fall back on the Census, the DOT, parcels, and your own feet. The dataset that is decisive in Los Angeles can be nearly empty in a county of forty thousand people.
And the niche decides which variable matters at all: urgent care wants insurance mix and age; an auto-parts store wants vehicle age and ownership; a children's brand wants households with young kids. No single platform indexes all of these — which is exactly why serious operators end up stitching two or three together.
Hacks to close the gaps
When a platform does not have what you need — or has no API to pull it from — a little code goes a long way. I asked Claude to write a few; here are three I reach for. Export your shortlist from LoopNet or Crexi as a CSV first; these enrich it, no scraping required.
1 · Geocode your shortlist with the free Census geocoder
# Claude wrote this: turn addresses into coordinates, free, no key.
import requests
URL = "https://geocoding.geo.census.gov/geocoder/locations/onelineaddress"

def geocode(addr):
    r = requests.get(URL, params={"address": addr,
        "benchmark": "Public_AR_Current", "format": "json"})
    m = r.json()["result"]["addressMatches"]
    c = m[0]["coordinates"] if m else None
    return (c["x"], c["y"]) if c else None  # (lon, lat)

print(geocode("123 Main St, Dallas, TX"))
2 · Pull demographics for a tract from the Census ACS
# Claude wrote this: median household income + population, free.
import requests
API = "https://api.census.gov/data/2022/acs/acs5"

def acs(state, county, tract="*"):
    p = {"get": "B19013_001E,B01003_001E",
        "for": f"tract:{tract}", "in": f"state:{state} county:{county}"}
    return requests.get(API, params=p).json()[1:]  # rows per tract

print(acs("48", "113")[:3])  # Dallas County, TX
3 · Find nearby competitors from OpenStreetMap
# Claude wrote this: count competitors within a radius, free.
import requests

def competitors(lat, lon, radius_m=1600, kind="car_wash"):
    q = f"[out:json];node(around:{radius_m},{lat},{lon})[amenity={kind}];out;"
    r = requests.get("https://overpass-api.de/api/interpreter", params={"data": q})
    return [e.get("tags", {}).get("name", "?") for e in r.json()["elements"]]

print(len(competitors(32.78, -96.80)))  # ~1 mile around downtown Dallas
None of this is exotic. It is the free public data — the Census, the DOT, OpenStreetMap — that the expensive platforms repackage, pulled directly and joined to your own candidates. The catch is simply that it is code.
From scripts to a system
Because that is the real wall: most franchise owners are operators, not programmers. Knowing a fifteen-line script exists is not the same as installing Python, managing an environment, and trusting the output. And someone still has to verify the results — that the geocoder did not drop a site in the wrong county, that the competitor list is not full of duplicates, that the numbers are sane — before you sign a lease on them.
So picture the next step: an aggregator that takes a plain-language brief, decides which sources and scripts to run, runs them, checks its own work, and hands back not a CSV but a finished, styled map — your candidates scored and ranked, ready to share with a partner or a landlord.
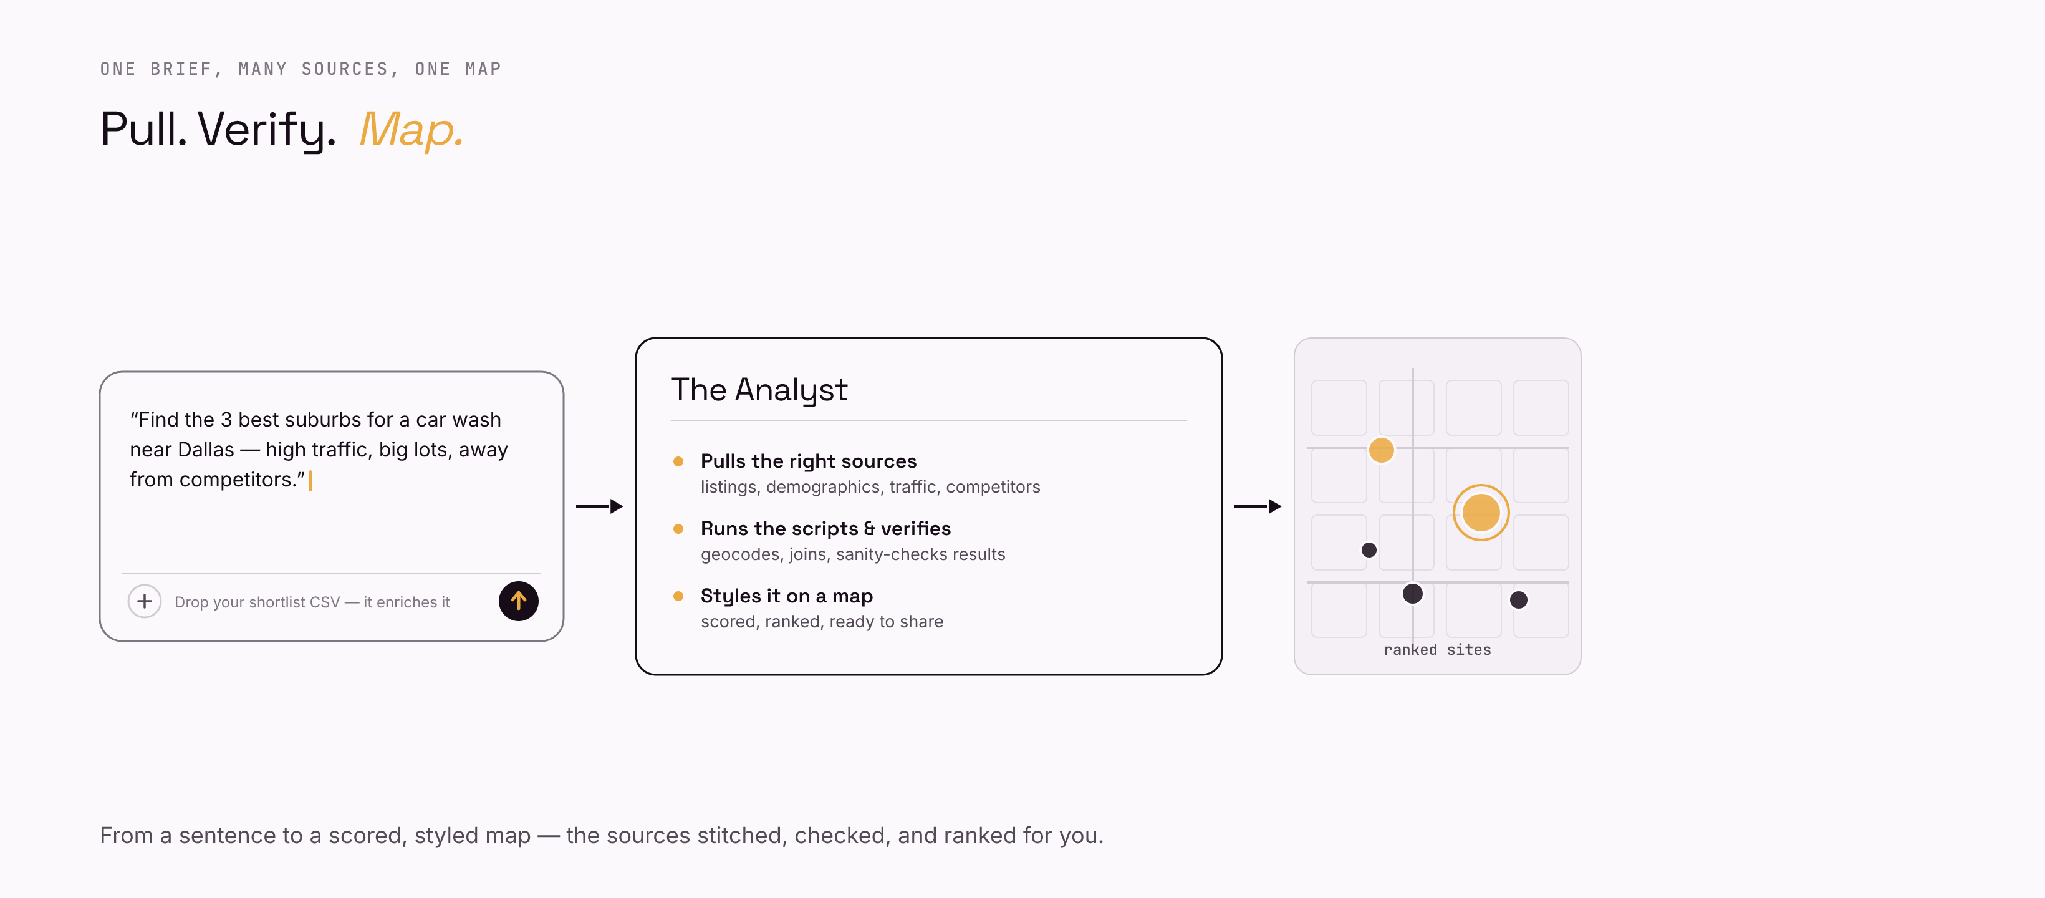
Figure 2 — One brief, many sources, one verified and styled map.
That is what NIKA Analyst already does. Give it a brief — say, for-sale properties under a million dollars in Los Angeles — and it searches the listings, builds the GeoJSON, creates the map, and styles the points itself: coloured by price, sized by square footage, then flown to the right city. A hundred listings become a map you can read at a glance, on a workflow we have tested hard enough to trust. The scripts in this essay are exactly the kind of thing it runs for you — it picks the sources, verifies the output, and places the result on a properly styled map without you touching a line of code or worrying about which platform has an API.
Site selection will always need your judgment — the drive-by, the gut read, the landlord conversation. But the part that used to take an analyst a week of stitching data sources together is now a sentence.
Scouting your next location? Put your shortlist on a map: Try NIKA Analyst →
Notes & sources
LoopNet / Crexi / CoStar comparison, traffic and pricing: RealtyLync · American Net Lease
API access is enterprise/gated for the marketplaces: CoStar/LoopNet automation · Crexi data API
CBRE location analytics (Dimension, Retail Analytics): CBRE Site Selection
Foot-traffic providers (Placer vs SafeGraph): pricing, accuracy, panel bias: GrowthFactor
Free public data with open APIs used in the hacks: US Census ACS · OSM Overpass